A Tanker Forecasting approach
Predicting is difficult, especially if it's about the future.
With limited activity in the oil market these days, we turn our focus to the upcoming year and attempt to anticipate what’s in store.
I’ve tried forecasting rates before, but in a market with realized volatility exceeding 100%, it’s often a fool’s errand. Nevertheless, we can at least identify the variables underpinning the supply and demand dynamics of the tanker market.
This analysis will focus on the dirty tanker segment (crude oil, condensates, fuel oil, and feedstocks). We covered the supply side of tankers in a previous article, noting that the second half of 2025 will bring the most tonnage.
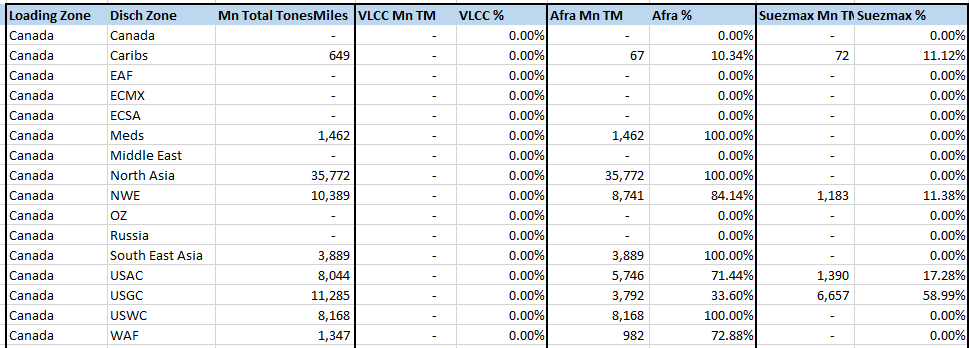
Now, let’s examine the demand side using one of the industry’s favorite metrics: Ton-Miles. This metric is calculated by multiplying the tonnes loaded by the miles of the voyage, aggregating these values to provide a sense of overall demand.
The tricky part of this approach is projecting both the tonnage (production/consumption) in key regions and the origins and destinations of flows. This requires numerous assumptions, but with a methodical approach, it’s manageable.
As the year comes to a close, we break total ton-miles down by region to identify which areas are driving demand and where flows originate. Once that’s done, we further disaggregate by vessel class, providing insights into the impact on specific trade routes.
Here’s the forecasting process: rearranging total flows with all assumptions incorporated. Since we’re discussing total dirty flows, this includes crude oil and feedstocks, which align more closely with factors like refinery closures, environmental policies, and geopolitical events.
My assumptions are based on:
Declining production in certain regions (e.g., ECMX).
New refinery additions (e.g., Middle East, West Africa).
Pricing, which ultimately dictates flow patterns.
I’ve approached this conservatively, but I suspect I might be biased towards:
The Middle East pricing more competitively than the Atlantic, leading to increased flows to Asia.
Smaller vessel classes supported by more regional trades.
Local crude production feeding domestic refineries, with feedstocks exported.
A slowdown in Asian demand.
The Atlantic seeing long crude barrels but short feedstocks.
Russia reducing feedstock exports.
Once we establish total flows, we apply the revised ton-mile figures to the breakdown by route and vessel type. This assumes that the distribution between vessel types remains constant, though in reality, it will shift based on economic conditions. For simplicity, we’ve kept it constant, but the model allows for further refinement.
And that’s how we arrive at the 2025 total ton-miles estimate.
Do Ton-Miles Predict Prices?
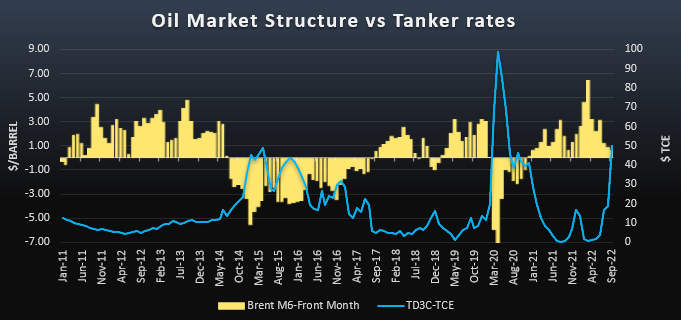
The tough question: do ton-miles predict prices? No—but they’re a useful tool for identifying trends and rate ranges. Ultimately, the best proxy for rates is utilization, which is influenced by flows as well as weather, operational constraints, trade disputes, and other factors. That said, here’s where we stand heading into 2025.
Now, let’s abandon the scientific method and rely on instinct.
If the 2025 oil balance projections from major analytical groups are accurate—suggesting a 1 million bbl/day surplus in Q1 that builds into Q2—prices should decline sharply, pushing the market into contango. In that scenario, tankers could perform exceptionally well in the first half of the year. However, the second half of the year could be more challenging, with newbuilds entering the market and stocks drawing down.
I know you came here for numbers, so here’s my 2025 tanker rate outlook, based purely on instinct:
VLCC: $36,500
Aframax: $27,200
Suezmax: $24,900
Panamax: $22,300
Let’s revisit this in a year and see how we did!
The xls file is for our paid supporters


