


Last week we saw a simple arbitrage with refined products, when basically we were comparing landed values for different origins to a target destination. For crude arbitrages the mechanics are the same but with some nuances, we are actually not comparing just landed values, but crude properties as well, since crude is not an end product, but an intermediate one so it is valued at its specific output.

Broadly speaking, crude oils are classified by API gravity (Heavy <25°, Med 25-34° and light >34°) and by sulfur content (Sweet <0.6% of sulfur content, Sour >0.6%) but no crude is the same, regardless of these two properties, there are more qualities as acidity, water content, etc...we won’t get into chemistry, but consider that different crudes yield different cuts of refined products. If you are interested, check BP or Equinor crude assays (test labs)
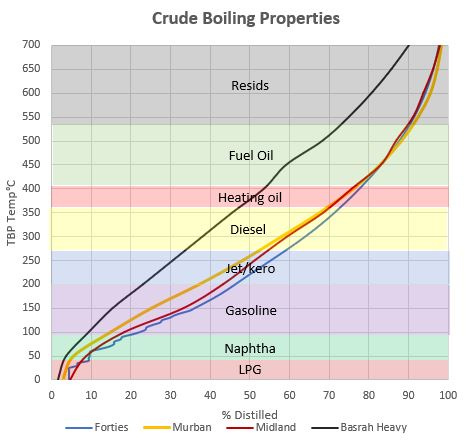
Cracking is all about breaking down molecules applying heat and pressure, and oils behave differently under this process. In the image above, there is what it is called a “yield curve”, which shows how much of a crude is distilled (boiled) at different temperatures (True Boiling Point). We have 3 “Light Sweets”, Murban, Forties and Midland, and though by API and sulfur content are similar they are slightly different in what they produce, for comparison there is a “Heavy Sour” Basrah Heavy and see the difference in the curve, and look how much distillates and fuel oil it leaves in comparison with lights sweets.
You might have heard prices assessments for similar crudes at different values, Bonny Light is a light sweet like Brent/Forties but is more expensive because it yields better, generally speaking WAF grades are better quality. Traders know this, refineries know this, and now you know this.
But wait, there is more! As not every grade is identical, no refinery is similar either, so to further complicate things, let’s talk about refinery configurations:
We can classify them between simple and complex, given the number of processes the crude goes through, for example, on a complex refinery system, the crude is boiled, then was it is left at the bottom is re-run in another type of column or furnace to further extract more valuable fractions (gasoline, diesel) and so on. Simple refineries don’t have the ability to re-process heavy bottoms, so they are more inefficient.

There are a lot of models for refinery yields vectors, but the industry standard, at least for traders, is based on the one like the image above from IEA which also regionalizes the output.
When a refinery is built, it is built with a certain type of crude in mind, a baseline grade. That’s why the US Gulf Coast is stuck with heavy sour optimized refineries, those were planned when Venezuelan oil was the preferred feedstock.
In essence, crude oil arbitrage calculations assess the financial advantage of processing an alternative crude oil compared to a baseline crude. This advantage is determined by analyzing the difference in refining margins between the alternative and the reference crude within a representative refinery in the target market. And as we did with refined products, we need to place both crudes at the same place and ant the same time.
Look at it from the perspective of a refinery planner or optimizer, you need to get the cheapest grade that yields the most, a trader’s job is simply to anticipate to the refinery planner and take a position to front-run the refinery.
Let’s take a look at a common arb, the transatlantic arbitrage between Midland and Forties landing in Europe.

We have our spot price for “WTI Fob”, which is WTI, the future + another differential to put it in the water, adding a differential (WTI MEH) which is a swap that trades constantly, we have our spot assessment, which indicates our prompt date, in the case of WTI loading after the next 10 days.
We need our freight price, which is also spot, in this case an Aframax, and now we know our loading date and transit time, we know we land on Aprl 28th. This is our alternative crude.
Now we work backwards from that date for our baseline. We know it has to land on Aprl 28th, we know the baseline for North West Europe is Forties blend, and is loaded in Scotland so it takes one day to get to Rotterdam. We now have that loading date (Aprl 27th). The spot assessment for loading on that date is made 10 days before (the mighty Dated Brent) so we need a price for that loading window, do we have that one? NO, but we can infer that from the Brent curve. Similar to the freight component from Scotland to Rotterdam, we don’t have the freight rate yet but again, we can do a liner extrapolation and have an idea.

Now we have all our 4 prices, we compare the landed prices, and we see that actually WTI is landing a 0.50 disadvantage to Forties… Arb is closed. And we would normally leave it there as we did last time... but what if we run these barrels through a refinery? They yield slightly different, and Midland is known to run better than Forties in Europe. The value in yields favors Midland, and when you net the landed value delta, you still come out ahead with Midland. Arb is open
This example is close to what is happens in practical terms. Arbs are either always shut or marginally open like this one. The reality is that you won’t do this trade for just 0.20 cents per barrel, you need at least a couple of bucks to make it worthwhile, and to cover for contingencies (ops delays, demurrage, etc..)
On top of this, I left out some other expenses like insurance for the cargo, crude loss in transit, capital costs and operational costs to run a refinery ($3/4 per barrel) so margins are even tighter.
I’m sure we have some “refinery guys” reading, so please chime in and feel free to educate me.
In this day and age, pretty much all the crude grades are priced to perfection, the only lagging price is the freight component, which has its own supply/demand dynamics but even then, the opportunities are scarce. I used these arb calculations to detect when tanker rates are out of whack, rather than a crude play.. but they do exist.
Refineries have built-in in their systems how to value every crude in real time, traders thrived on information asymmetry that is not longer here, so, if everything is hedged and priced to perfection, how do traders make money then? We’ll see that next week
Spoiler alert: they are a bunch of gamblers
Appreciate the fascinating write up. Really difficult to find this quality information anywhere on the internet. Quick question, where did you go about getting the yield assay data? Looking to play around with other oil grade from "Platts Periodic Table of Oil" but can't seem to get the yields
Appreciate market is dynamic and as you say arbs don't always exist. Roughly speaking, across different strategies (geographical, calendar, specs and others), where are most of the VaR deployed?